For those who live in the northeastern U.S. or southeastern Canada, an unusually active stretch of severe winter weather began in late January 2015 and is ongoing in the middle of February at this writing. This stretch has featured many rapidly developing lows tracking from the northeastern U.S. over the western Atlantic along or near the coast. The result has been tremendous amounts of snow for many locations — particularly New England — and also some very strong winds and rough seas, which have led to serious impacts in coastal areas. Tidal flooding, beach erosion and even the loss of some shorefront homes have occurred. Even for those who do not live in these areas, it has been hard to escape the relentless media coverage of these events.
One aspect of these winter storms that doesn’t get much coverage from the land-based media is freezing spray over open waters. A combination of factors is necessary for freezing spray to occur. Air temperatures must be below the freezing point of salt water (approximately 28°F), winds must be strong enough to lift the spray off the ocean surface and waves must be high enough to disturb the ocean surface in order to facilitate the action of the wind. If waves are large enough to break, then that action alone will send spray into the air.
Freezing spray is a serious concern for ocean voyagers because once the spray is airborne then, under the right conditions, it will freeze as soon as it contacts any surface. This will lead to ice accretion on every exposed portion of a vessel, including decks, superstructures, spars, shrouds and more. It may cause communication equipment to cease functioning and could lead to loss of function of mechanical parts. However the most serious impact of ice accretion is reduced vessel stability. The added weight of ice adhering to a vessel above the waterline will change the center of gravity of the vessel and make it much more susceptible to capsizing.
 |
|
Fig. 2: Symbols found on surface forecast charts that indicate moderate and heavy freezing spray. |
Many ocean voyagers avoid passages during the cold season, but there are occasional situations where, due to schedule issues, a delivery needs to be made at the time of year when ice accretion could occur. Also, for those who have boats stored on land in yards right along the water — particularly when the standing rigging remains in place and conditions in the nearshore waters are conducive to producing freezing spray — if the winds are onshore, ice accretion could occur. In these cases, it would be best to make sure that the cradle, trailer or jackstands are capable of dealing with the extra forces produced by the added weight of ice accretion.
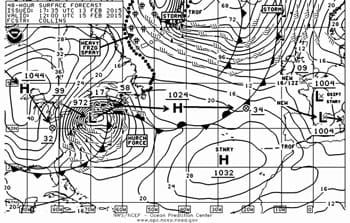
Areas of ice accretion are shown on surface forecast charts. An example is shown in Figure 1. Typically, a textbox will be included, such as the one shown over northern Canada pointing to the northern Labrador Sea indicating “HVY FRZ SPRAY”. In addition, there are symbols shown on the charts indicating moderate and heavy freezing spray. These symbols are shown in Figure 2, and several of them can be noted on the surface chart in Figure 1. Also, the boundary of the area where ice accretion is occurring is indicated on the surface forecast chart by a line of alternating outlined dots and dashes. In the case of Figure 1, this line extends from the central Labrador Sea northeast to southern Greenland.
There are also some experimental products available on the Ocean Prediction Center, which quantify expected ice accretion. Here is the link to these products: http://www.opc.ncep.noaa.gov/icing_rates/compare.php?area=ak. There are a few different algorithms being used, but the output of each indicates the amount of ice accretion expected at the valid time of the chart. Some indicate the amount in centimeters per hour, others as a category referring to a range of values. There is a drop-down menu at the top left of the page allowing the selection of a region, and there are links right above the maps to select the forecast time.
 |
|
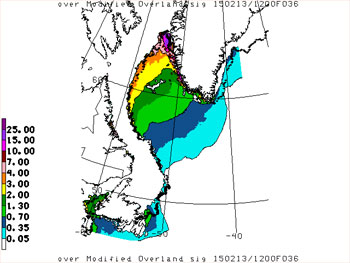
Fig. 3: An experimental chart showing ice accretion in centimeters per hour. |
Figure 3 shows one of these experimental charts, in fact one valid 12 hours earlier than the surface chart shown in Figure 1. This allows comparison of the two ways that freezing spray can be displayed. The scale on this particular chart indicates ice accretion in centimeters per hour. It is important to note that the experimental chart has a different labeling scheme. While the surface chart shows an issued time and a valid time (1200 GMT Sun 15-Feb-2015), the experimental chart gives the date/time group of the initialization time of the forecast (150213/1200 – corresponding to Feb 13, 2015 at 1200 GMT) and the time of the forecast (F036 indicating a 36-hour forecast). It is necessary to apply the forecast time to the initialization time to determine the valid time of the chart — in this case, 0000 GMT Feb 15, 2015.
Note that there is an area where no ice accretion is indicated on the experimental chart between the coast of Labrador and the colored areas well offshore. This area corresponds to the region where the sea surface is frozen, as indicated on the surface chart in Figure 1 by the solid dotted line which shows the ice edge. Freezing spray is not likely to occur in this area simply because there is no open water.
As noted above, many ocean voyagers will not need to worry about ice accretion because they will not be voyaging at a time and place where it may occur. However, it is a good idea to be aware of the situations where it may occur and the dangers that it poses just to be prepared for that late season delivery some year when unusually cold conditions could have an impact. It is also important in these situations to know where to obtain information to help determine the risks.