Whenever a tropical cyclone (tropical depression, tropical storm or hurricane) is present, there is a large amount of information available to help the public understand the outlook for the system or systems of interest, and also to help with decisions that need to be made and actions that need to be taken. In the U.S., much of this information — including all official watches and warnings — is provided by the National Hurricane Center. In fact, the amount of information that is available is somewhat mind-boggling, especially when compared with the situation a generation ago.
It’s hard for many folks today to remember a time when the Internet was not an overarching presence in our lives, a time before there were smartphones and cable TV channels devoted to weather, and a time when most folks got their most up-to-date information regarding tropical cyclones mainly by listening to the radio.
Of course, forecasting skill has improved dramatically since that earlier time, and the public now expects that accurate forecasts of hurricanes out three, four or five days are somewhat routine. In most cases, the information available allows those likely to be impacted by tropical cyclones to have at least a few days to make necessary preparations.
In recent years, several graphic presentations have been developed to present information. While these presentations have the ability to increase the amount of information at the public’s disposal, the number of different presentations also has the ability to confuse users, particularly if they are not familiar with what is being presented. This article will look at the graphics that are available and provide explanations of how they should be used.
The cone
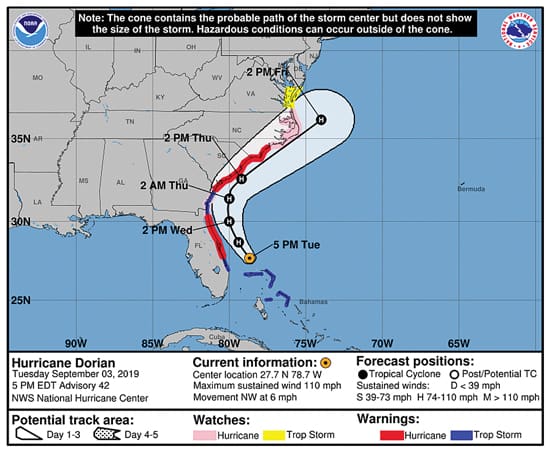
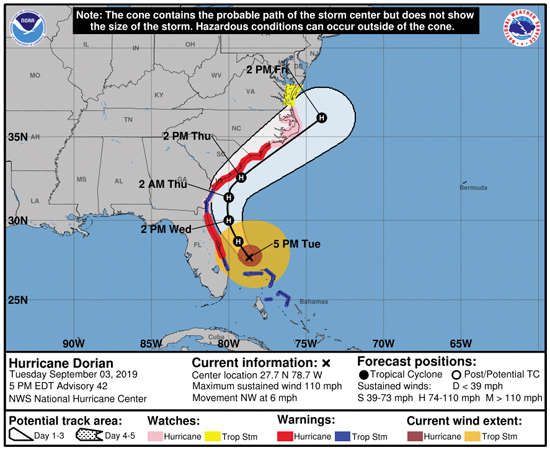
One of the most widely referenced graphics is the “cone” (see Figure 1 below). This graphic shows the current position of the center of the tropical cyclone, as well as the forecast positions of the center for the next three or five days. In order to show the uncertainty of the forecast track of the system, a widening cone is depicted moving away from the current position. The size of the cone is based on the official forecast error statistics, and it is constructed so that it encloses an area that represents two-thirds of all the center position errors at each forecast time for the previous five years. In other words, the center of the tropical cyclone can be expected to track within the cone about two-thirds of the time.
 |
|
Fig. 1: Three-day “cone” graphic including the track line produced by NOAA’s National Hurricane Center (NHC) on Tuesday, Sept. 3, 2019, at 5 p.m. EDT for Hurricane Dorian. |
|
NOAA |
It is important to understand that the size of the cone is not dependent on uncertainty factors connected with the specific system, but instead is based on recent historical averages. It is also important to understand that the cone gives no information about the size of the system of interest, or about the area that the system may impact. It is strictly a depiction of where the center of this system is forecast to track, with the cone depicting a historical error average.
If watches and warnings have been issued for coastal locations for a particular system, they will be shown on the cone graphic. The cone graphic also shows the classification of the system at each forecast time (tropical depression, tropical storm, hurricane, major hurricane, post-tropical cyclone or potential tropical cyclone). Cone graphics can be obtained for three- or five-day forecasts, and can include the forecast track line or not. The cone graphic is very useful to get a quick indication of the forecast for a particular system, but it does not provide a complete picture.
Wind fields
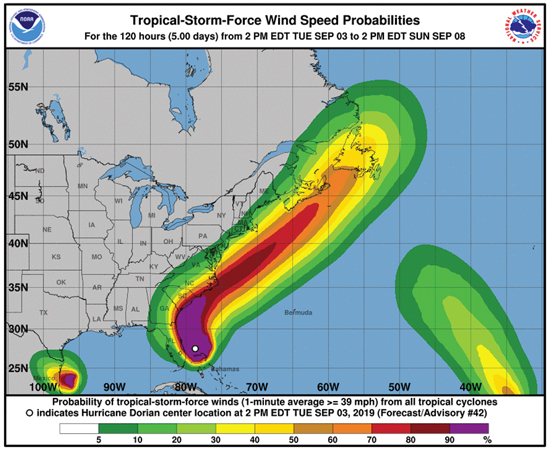
The winds produced by tropical cyclones can cause a good deal of damage, and the size and shape of the wind field is different for every system. There are now graphics that show the current wind field as well as the forecast wind field (see Figure 2 below). These graphics show the probability of certain key wind speeds through the five-day forecast period. They are available for wind speeds of 34 knots (threshold of tropical storm status), 50 knots and 64 knots (threshold of hurricane status). In contrast to the cone graphic, the wind speed probability graphic does give an indication of the size of the system of interest, in addition to the area that it is forecast to impact.
 |
|
Fig. 2: Tropical Storm-Force Wind Speed Probabilities graphic produced by the NHC for five days, starting at 2 p.m., Sept. 3, 2019, for Hurricane Dorian. This graphic also shows wind probabilities for other tropical systems present in the Atlantic basin. |
|
NOAA |
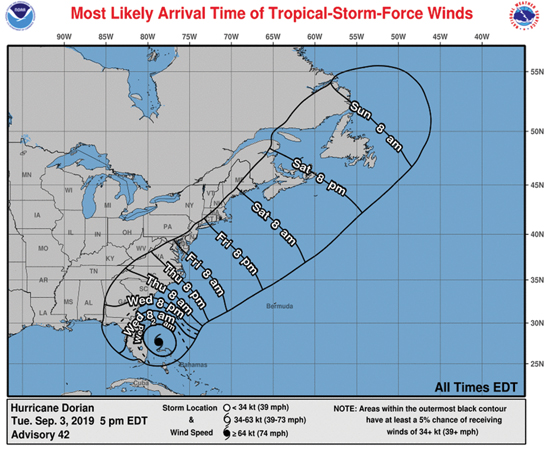
The wind speed probability graphic is a composite of the winds produced for the entire forecast period (up to five days) of a particular tropical cyclone. In other words, it does not give any indication of the timing of the winds in any particular location. There are graphics available that show the forecast arrival time of tropical storm-force winds, and this answers the timing question (see Figure 3 below). Two versions of this graphic are produced: One shows the most likely arrival time of tropical storm-force winds, and the other shows the earliest reasonable arrival time of tropical storm-force winds. The latter version indicates a time before which there is a less than 10 percent chance of experiencing tropical storm-force winds. The two versions look very similar, so it is important to pay close attention to the title of the graphic.
 |
|
Fig. 3: Most Likely Arrival Time of Tropical Storm-Force Winds graphic for Sept. 3, 2019, at 5 p.m. EDT. |
|
NOAA |
Another significant impact of tropical cyclones for coastal areas is storm surge, which is the result of water being forced inland by strong onshore winds and the very low pressure of a tropical cyclone. Storm surge is very complex and is impacted by the shape of the coastline, the adjacent undersea terrain and the time of the astronomical tidal cycle, in addition to wind and pressure considerations. Storm surge watches and warnings are now issued, and graphics are available to show areas where storm surge has the potential to cause flooding and the extent of that flooding.
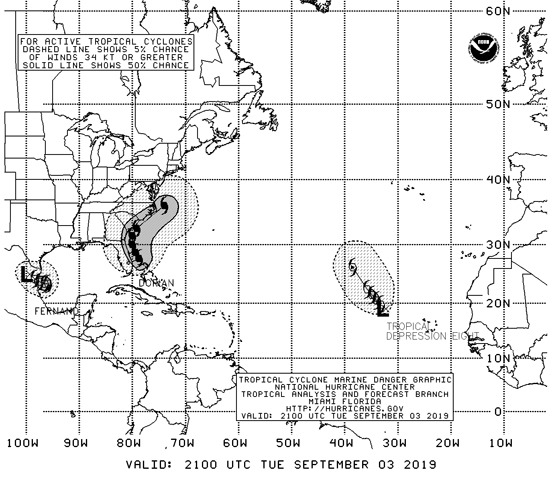
The graphics that we have discussed so far are aimed primarily at those who are on land. For those at sea, there is another graphic that may be more useful, and this is the Marine Danger Graphic (see Figure 4 below). While this graphic also shows the track and center positions of active tropical cyclones in either the Atlantic or the Pacific, its focus is on the area where tropical storm-force or greater winds are forecast to occur during the five-day forecast period. There are two areas shown: one where the chances for tropical storm-force winds are 5 percent or more, and enclosed within this area, a smaller area is shown where the chances for tropical storm-force winds are 50 percent or more.
 |
|
Fig. 4: The NHC’s Tropical Cyclone Marine Danger Graphic for the Atlantic produced on Tuesday, Sept. 3, 2019, at 2100 UTC (5 p.m. EDT). This shows the danger area for active tropical cyclones in the Atlantic (Dorian, Fernand, Tropical Depression 8). |
|
NOAA |
Information overload?
There are some who may contend that all of this information in graphic form will lead to information overload, and there is some validity to this thought. In fact, there is the capability on the National Hurricane Center website to view many combinations of the graphics that have been discussed overlaid with one another (see Figure 5 below). There is no question that all of the graphics have a great deal of value, and they allow users to evaluate each system and its forecast more fully, but all the information that is available may beg the question: What is most important? Or, perhaps: What should I pay the most attention to? The answer to these questions depends on whether the user is on land or at sea.
 |
|
Fig. 5: Cone graphic as in Fig. 1 but overlaid with current wind field. Overlays of Wind Speed Probability and Arrival Time of Tropical Storm-Force Wind graphics are also available. |
|
NOAA |
On land, the greatest weight should be given to the watches and/or warnings that have been issued. These are the areas where the forecasters at the National Hurricane Center have determined that actions are required (or may be required very soon) in order to protect life and property. All of the graphics allow users to get a more complete picture of the relevant system, but the watches and warnings are the calls to action and should be treated very seriously. Watches and warnings are depicted on the cone graphic (except for storm surge watches and warnings) but are also available through many other means (text products, radio and television broadcasts, etc.).
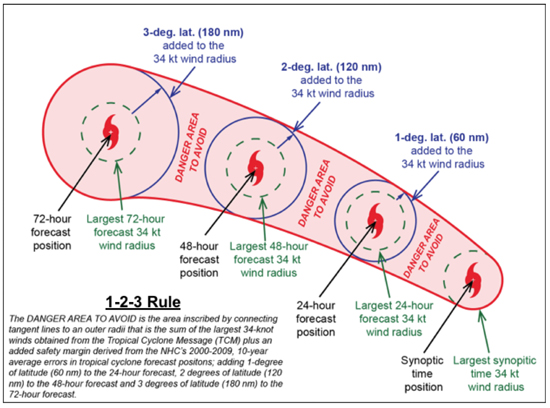
At sea, the most important factor is the wind — which in turn gives rise to the sea state — and the 5 percent line on the Marine Danger Graphic is an excellent guideline for mariners to use as an area to avoid. This area lines up very well with the “1-2-3” rule, which is a method of constructing a danger area to avoid from the information in the text advisories (see Figure 6 below). Thus, if one is offshore with no capability to obtain graphic products, this danger area can be plotted directly from the text advisories, which are easier to obtain offshore.
 |
|
Fig. 6: Method of plotting the 1-2-3 rule using text advisories to construct a danger area to avoid for tropical cyclones. |
|
NOAA |
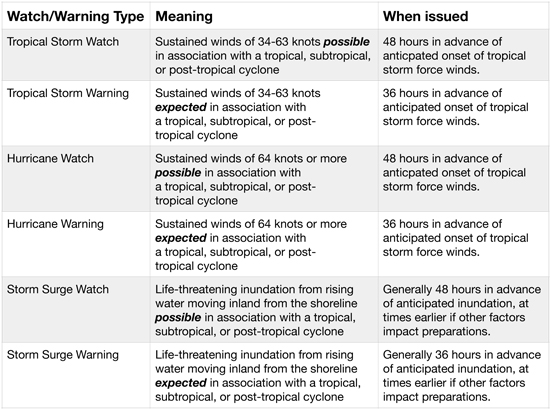
By now, the astute reader may have noticed that many of the products focus on the threshold of tropical storm-force winds, which is 34 knots. There are good reasons for this. In terms of those based on land, when sustained wind speeds reach 34 knots, it becomes more difficult to work outdoors on any preparations for the upcoming system, and this is why the timing of all watches and warnings is keyed to the onset of tropical storm-force winds, even watches and warnings for hurricanes. While at sea, once a vessel is inside the region of sustained tropical storm-force winds, navigation options become more limited due to wind direction and building sea state.
 |
|
A breakdown of the various levels of watches and warnings issued by the NHC to indicate possible effects. |
|
NOAA |
For those who may be impacted by tropical cyclones, it is worth spending time visiting the NHC website (www.nhc.noaa.gov) to become familiar with the available graphic products and their combinations in advance of having to use them in real time. Above all, pay attention to watches and warnings when they are issued, and the Marine Danger Area when offshore. Use the graphics to supplement this material and help gain a more complete understanding of each system, as this will then lead to making prudent decisions and taking the actions needed when required in a timely manner.
Ken McKinley is the founder of Locus Weather, which provides weather routing to a variety of clients.