 |
|
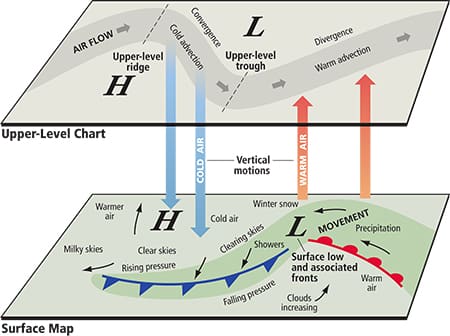
A depiction of the relationships between upper level (500 mb) and surface conditions. |
Every sailor has experienced times when the weather forecast differs substantially from reality. To make matters worse, this condition might persist for several days, confounding efforts to determine the cause. Sometimes this is caused by a condition called a “cut-off” low, which voyagers should be able to recognize from weather charts.
On examination of the weather maps, one may observe that local conditions are dominated by a prominent low-pressure system showing relatively little to no movement over a period of days, and even some retrograde motion with the system moving to the west, counter to the usual progressive easterly flow of weather systems in the Northern Hemisphere. Such aberrant behavior is characteristic of low-pressure systems that have become separated from the upper-level steering winds, resulting in free-form movements that are difficult to predict.
These cut-off lows form a subset of the class of atmospheric low-pressure systems (other members include tropical and extratropical, as well as primary and secondary lows) that is often overlooked, despite their influence, since they are not prominently called out in the forecast. Resolution requires careful examination of the weather maps and some familiarity with the structure of the cut-off low and the processes responsible for its formation. Is this extra effort of value? To answer that, one must understand just what a cut-off low is and how its presence can affect surface conditions and forecast accuracy.
 |
|
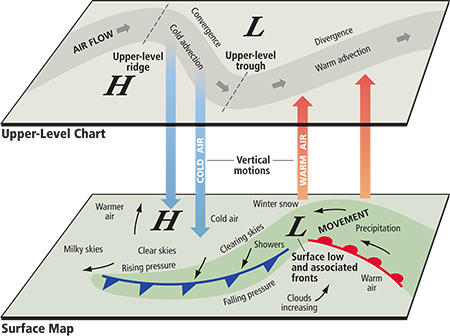
Sequence shows how a meander develops in a flow and then can get cut off. |
Conditions aloft are key
We live in an ocean of air heated by incoming solar radiation and heat from the Earth’s surface. The differences in heating from the equator to the poles create global-scale pressure differences, producing the winds we seek as sailors. Moving over the surface of our rotating Earth, these atmospheric flows change direction progressively and encounter varying terrain, from continent to ocean, and associated friction and thermal patterns. The result is a thoroughly time-variant three-dimensional flow. In this system, to really understand surface conditions you need to evaluate concurrent conditions aloft. The close coupling between the upper-level and surface conditions is taught early in introductory meteorology.
In the Northern Hemisphere, the atmospheric circulation field is divided into three regions: the equatorial or tropical, extending from the equator to approximately 30° N; the mid-latitudes from 30° N to 60° N; and the polar region from near 60° N to the pole. A similar pattern exists in the Southern Hemisphere. The boundaries of these regions are characterized by fairly distinct temperature and density differences that support flows or “jet streams” in the upper atmosphere that, in turn, circle the Earth. Due to the effects of the Earth’s rotation, these jet streams seldom flow in straight lines, more typically displaying sinuous patterns with differing wave lengths and amplitudes. The associated ridges and troughs induce rotations in the flow that often influence conditions down through the atmosphere to the surface, with ridges favoring surface high-pressure systems and troughs generating surface lows. As the waves progress to the east, the surface highs and lows tend to follow at speeds equal to 30 to 50 percent of the wind speeds observed on the 500-millibar (mb) chart, which generally indicates conditions found at approximately 18,000 feet above the Earth’s surface. It’s not unusual to see 500-mb winds in excess of 60 knots resulting in surface features moving at speeds in excess of 30 knots. This close relationship between upper-level conditions and those affecting us on the surface is important to keep in mind during routing exercises. Analyses and forecasts of conditions at the 500-mb level are included in the daily radiofax transmissions of the marine weather charts together with surface maps (e.g., tgftp.nws.noaa.gov/fax/marsh.shtml for the northwest Atlantic).
 |
|
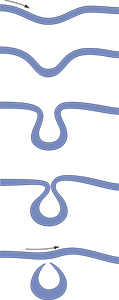
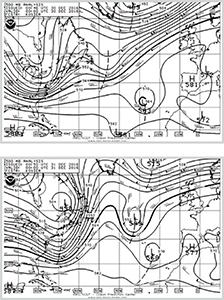
These two charts are 500-mb analysis charts for Dec. 27 – 28, 2016. They show a prominent upper-level trough developed near 50° W, resulting in the formation of a closed low on Dec. 28. |
On occasion, the amplitude of the waves in the upper-level wind field can increase substantially, forming short wavelength features similar to an oceanic wave approaching the breaking point. Such progression in the region of the wave crest can result in flows — which may initially be proceeding west to east — experiencing a series of abrupt changes in direction, going first south to north, followed by a swing north to south, resulting in a pattern similar in form to the Greek letter Ω . The prominence of this ridge can effectively block following waves, disrupting surface weather patterns and increasing the intensity of associated storm events. These abrupt ridges can be large in amplitude, spanning continents, and remain in place for extended periods, often in excess of a week.
Flows can become isolated
In the vicinity of the wave trough, increases in amplitude can lead to a situation similar to that occurring in a meandering river: Increases in the amplitude of the meander will ultimately lead to a “pinch-off,” leaving an isolated feature surrounded by water. In the upper atmosphere, a progressive increase in the depth of the trough can on occasion also result in a “pinch-off,” leaving a region of low pressure isolated from the main body of the flow. This is the origin of the “cut-off” low.
An example of this is shown in the North Atlantic 500-mb charts for the period of Dec. 27, 2016, to Jan. 2, 2017 (see image on next page). On Dec. 27, a prominent upper-level trough was developing near 50° W, resulting in the formation of a closed low on Dec. 28. At this time, the low remained under the influence of the upper-level flows clearly surrounded by the 564 contour. Over the next 24 hours, however, this low was separated from the main body flow and by Dec. 30 was positioned well to the south of the nearly west-to-east (or “zonal”) upper-level flows. It remained essentially in place until Jan. 2, when it was entrained by the western limb of an evident blocking ridge.
 |
|
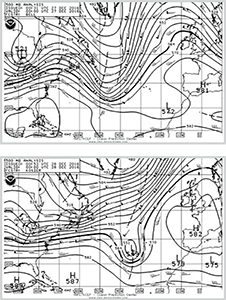
These two charts are the 500-mb analysis for Dec. 30 – 31, 2016. By Dec. 29 the low was separated from the main flow, and by Dec. 30 was well to the south. |
Surface analyses during this period showed the influence of the upper-level low extending to the surface, resulting in persistent gale to storm conditions. It’s also likely that air temperatures within the surface low were lower than the surrounding area since the upper-level trough orientation favored the dominance of colder subarctic air in the “cut-off” and its subsequent settling from aloft. In combination with the usual high water temperatures in this area, this contrast also favors rain together with the high winds. If that’s not enough, the duration of the event enhances surface wind wave development beyond that which occurs in a storm with similar winds but significantly faster movement past the area.
After examination of the life cycle of this cut-off low, it should come as no surprise that forecasting the behavior of such systems is difficult and in many cases impossible. Absent the influence of the upper-level steering winds, the low spins like a spinning top on a table, possibly remaining motionless unless affected by some surface irregularity, friction or decreasing rotationality. Forecasts using the widest range of information — including models, satellite and observer observations, and the skills of an experienced forecaster — have the best chance of yielding reasonable results. Simple dependence on models has probably the lowest. With this in mind, one must conclude that examination of the 500-mb charts for the presence of a cut-off low is definitely worth the effort and advisable in the interests of determining the probable accuracy of the weather forecast. In particular, longer-range GRIB products based solely on models can be especially susceptible to error in situations like these. Understanding the nature of the low-pressure systems likely to be encountered is essential to small boat routing and a safe, enjoyable passage.
W. Frank Bohlen is Professor Emeritus of Marine Sciences at the University of Connecticut (UCONN) and an experienced offshore racer and cruiser sailing out of Mystic, Conn., on his Ohlson 38. He is a regular speaker at Safety at Sea Seminars.