The oldest navigational tool of all is a good pair of eyes — like a lookout up the mast guiding a boat through coral or picking out buoys on a coastal passage. Now chartmakers are testing the use of imagery from “eye in the sky” satellites to determine chart depths.
Research has shown that water depth can be found by using different wavelengths of light. The development of this technique, called satellite-derived bathymetry (SDB), means that chart depths — especially for electronic charts — could be changed every time a new satellite image shows a discrepancy with previous data. And, it is possible that those changes could be made with limited physical data gathering by survey vessels. Researchers at NOAA’s Office of Coast Survey and chartmakers at the firm NV Charts are fine-tuning this process for gauging depth via satellite images. This technique is depth-limited and can only be used in shallow areas.
NOAA’s efforts have involved tests using the NOAA ship Thomas Jefferson in the shallow water and shifting sands of Nantucket Sound and at Chincoteague Island just off the Delmarva Peninsula. According to NOAA Officer Ensign Kaitlyn Seberger from Thomas Jefferson in her blog post on the technique, “NOAA Lt. Anthony Klemm, who is leading the studies, chose these project areas because they both had relatively clear shallow water and were in a highly changeable area. At these locations, he chose specific shoals for exploration based on vessel traffic density.”
The process originates in multispectral images from earth-imaging satellites like Landsat and Worldview2. The WorldView2 satellite, for example, provides a high-resolution panchromatic band and eight multispectral bands: four standard colors of red, green, blue and near-infrared, and four new bands of coastal, yellow, red edge and near-infrared. The researchers use just parts of the light spectrum because some frequencies of light penetrate seawater better than others. The two colors of light used are green and blue. Green light is affected by depth — the deeper the water, the more the green light is absorbed. Blue light, however, penetrates seawater better and falls off more slowly with depth. By comparing the green and blue responses, researchers can infer the water depth at that spot. Since the method only provides an inference of water depth, the SDB system needed to be proofed on-site to see if it could reliably indicate depth in shallow water.
In October 2015, Thomas Jefferson spent two days in Nantucket Sound testing the effectiveness of the SDB technique by overlaying the SDB data over the most current chart data. Then NOAA technicians gathered multibeam sonar bathymetric data in those areas using survey launches for areas with water depths six feet or greater, and small autonomous robot craft NOAA calls Z-boats in depths less than six feet.
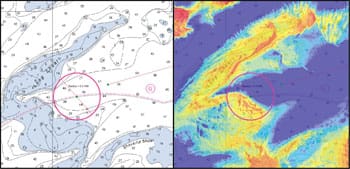
While conducting the surveys, the technique had an interesting real-world test. Thomas Jefferson had planned to anchor in an area that charts showed had sufficient depth to take the ship’s draft. When the researchers looked at the SDB data for that area, however, they found a shoal area that would have prevented anchoring. The shoal had shifted since the last chart survey of the area and the SDB data showed it.
As for the new multibeam survey data Thomas Jefferson gathered with launches and Z-boats, it generally confirmed the SDB predicted depths for area. According to NOAA, while the SDB technique looks promising, more research is needed. Ensign Seberger writes: “Limitations on use of the imagery can include variables such as cloud cover, turbidity, Chlorophyll a, and other water quality properties that may affect attenuation.”
A follow-up email from Thomas Jefferson commanding officer Capt. Shep Smith and Lt. Klemm summarized NOAA’s current thinking about future uses for SDB:
“1) Reconnaissance: We can use it to compare to the chart in historically changeable areas, such as ocean inlets, or in areas where changes have been reported. This is of great value to NOAA, as it now has a fairly inexpensive means to assess the adequacy of our charted bathymetry.
“2) Sonar-aided SDB: In an area that we see changes, we expect to be able to use a small number of new depth measurements … to calibrate the SDB, thereby making the depth estimates far more accurate.
“As we gain experience, we are also beginning to better understand more subtle failure modes …We feel that with more experience, we may at some point in the future be able to use SDB to create localized interim chart updates for potentially dangerous chart discrepancies until a systematic hydrographic survey can be conducted.”
The German charting company NV Charts is also experimenting with the SDB technique. The company is working with six other firms and with DLR, the German aerospace agency, on an Earth observation project called Marsat designed to improve maritime safety. NV Charts is taking the lead in the areas of SDB that involve monitoring channels’ changes. The idea is to use SDB to see if a fairway or channel depth changes due to shoaling. Another area NV Charts will investigate is employing SDB for determining changes brought on by hurricanes.
Since NV Charts has such detailed and complete chart data for the Caribbean, and since areas like the Bahamas have plenty of shallow water, some of which changes due to shifting sands and changing channels, NV is an excellent partner for handling the SDB aspect of the Marsat project. DLR is currently evaluating the project with an eye toward funding.