 |
|
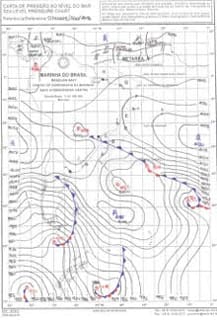
Figure 1: Surface chart valid at 1200 GMT Aug. 7, 2016, from the Brazilian Navy website. |
As I write this in August of 2016, the Summer Olympics are underway in Rio de Janeiro in Brazil. A couple of news stories from the first couple of days of the events noted that the weather was a factor in some events on the beach and on the water. In particular, beach volleyball was very difficult on one day because of strong winds, rough water caused by strong winds caused the postponement of some rowing events, and some of the early sailing competitions were quite exciting due to the strong winds. So it seemed like a good idea to focus this newsletter on the weather in this area, including providing some resources that could help in this part of the world.
First, a little about the location: Rio is located along the Atlantic coast of Brazil at a latitude of approximately 23° S. Despite the fact that we are talking about the Summer Olympics, it is actually winter in Rio because of its southern hemisphere location. However, its latitude is in the tropics, similar to the latitude of Havana, Cuba, in the northern hemisphere. Unlike Havana, though, there is a large and mountainous land mass to the west of Rio — the South American Continent. In fact, there are high mountains very close to the coast and within the city limits.
Rio’s tropical latitude means that true winter weather is extremely rare. However, the southern hemisphere storm track migrates closer to the equator during the winter season, just as it does in the northern hemisphere, and stronger storms are likely during this time of year. The storm track is still well to the south of Rio, but during the winter, cold fronts trailing north or northwest from low centers can occasionally push as far north as Rio. Also, strong highs can build north from southern South America into southern Brazil as colder air moves equatorward behind storms. Both the passage of cold fronts, and strong highs building to the southwest (thus increasing the pressure gradient) will produce strong winds in Rio, and because of the high terrain near the coast, those winds can be enhanced at times.
 |
|
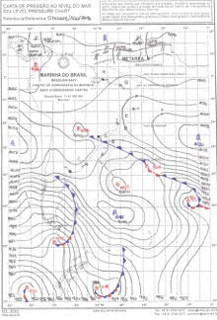
Figure 2: Surface chart valid at 1200 GMT Aug. 10, 2016, from the Brazilian Navy website. |
A good website for weather in this area is that of the Brazilian Navy. This site provides surface charts for the region, forecast model data and text forecasts for many areas, including Rio and Guanabara Bay. We can examine some charts around the time of the Olympics to see what has been happening. By clicking on the “Synoptic Charts” link, we are brought to a page that shows the most recent surface weather chart, as well as drop-down menus that allow access to older charts. The basic features and symbols shown on the charts are quite similar to U.S. charts that many readers are familiar with — isobars are drawn every four millibars and the frontal symbology is the same. One striking difference is that highs are labelled with an “A” instead of an “H”, and lows are labelled with a “B” instead of an “L”. This is due to the Portuguese names of these systems: for highs, “Centro de Alta Pressao,” and for lows, “Centro de Baixa Pressao.”
Figure 1 is a surface chart from Aug. 7 at 1200 GMT (0900 local time). The South American continent is clearly visible on the right half of the chart, and the Antarctic Peninsula can be seen extending north from the bottom of the chart. The area labelled “C” along the eastern coast of South America is the region that includes Rio de Janeiro. It must be kept in mind that because this is the southern hemisphere, the circulation around highs and lows is opposite that of the more familiar northern hemisphere. This means that winds will circulate in a general clockwise direction around lows, and counter-clockwise around highs. Notice a cold front extending from a low center west-northwest toward the Rio area. As this cold front approaches the Rio area from the south, winds will be west or WNW ahead of it; then, behind the front, winds will shift to SSW or southwest. Winds will likely be enhanced due to the instability associated with the front and the high mountains very near the coast. The day that this chart was valid was the day noted above where rowing was cancelled and beach volleyball was impacted.
Figure 2 is a surface chart from Aug. 10 at 1200 GMT (0900 local time). This was another day when most rowing events were cancelled due to high winds. In this case, a low center was located to the southeast of Rio with a cold front nearly through the area. There was also a fairly strong high (1,028 millibars) located over extreme southern Brazil, and the pressure gradient between these two features would generate moderately strong winds from the south. Also notice on this chart that there are many isobars in higher latitudes (south of about 45° S) with a 942-mb low near the bottom of the chart. This type of strong storm is not at all unusual in the South Atlantic during the winter and with such a strong pressure gradient over such a large area, very large seas will be generated.
At the top of each chart, the Intertropical Convergence Zone can be seen along with tropical waves extending to its north in the lower latitudes of the northern hemisphere. Quite a range of conditions are shown across this chart!
While the information on the website is not as extensive as that on other websites around the world, it still allows an examination of weather patterns in the region and information that will allow a mariner to determine what is likely to happen in the near term.