As we have passed the summer solstice, many U.S. ocean voyagers may be heading north or south of the border. While the weather products provided by NOAA’s Ocean Prediction Center provide weather and sea state information that will be relevant for such passages, there are resources available both north and south of the border that may provide a better visualization of the conditions in your area of interest.
Before moving ahead, here is an important reminder for all who regularly use the Ocean Prediction Center products: Their web address is changing. Actually it has already changed; in fact, the change occurred quite some time ago. However, the old web address has been redirecting to the new address, but that will stop occurring very soon (in July) so users need to make sure that bookmarks in web browsers are changed to ocean.weather.gov.
First, let’s look north. Environment Canada is the Canadian national meteorological service. By scrolling down and clicking on the “Marine” link, you’ll go to a page with links to text forecasts and charts. The charts available are for wave heights, sea ice and sea surface temperature. The sea surface temperature chart is a rather large-scale chart, and while it is possible to get a general idea of the location of the Gulf Stream, charts from other sources will be of greater value for this use. A large-scale sea ice chart is also available, but there are also more local charts that can be accessed that show more detail — if voyaging to coastal locations, these are the charts that should be consulted.
It’s important to understand that sea ice is different than icebergs. Sea ice is frozen seawater, but icebergs are frozen fresh water and come from glaciers in coastal areas. Sea ice charts will generally not indicate the presence or absence of icebergs — for iceberg information, it is necessary to consult the North American Ice Service chart, which can be found in the list of ice products. This is particularly important in the waters east of Newfoundland where sea ice is generally gone by late spring but icebergs will be present into the summer.
 |
|
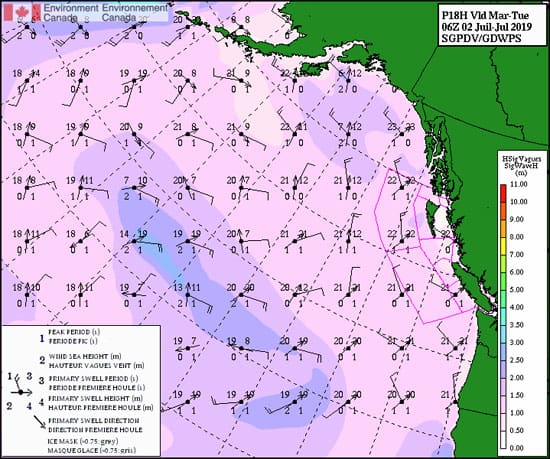
Figure 1: Wave height chart from Environment Canada for the northeastern Pacific, 18-hour forecast valid at 0600 UTC on July 2, 2019. |
The wave charts provide model forecast data and are available for several regions. They show a good deal of data about forecast sea state and winds. Figure 1 is an 18-hour forecast valid at 0600 UTC on July 2, 2019. The legend on the chart indicates where information can be found regarding wind waves and swells, including both the wave heights (in meters) and periods (in seconds). The peak period is the period of the waves with the most energy. Sometimes this will be swells (longer periods) and sometimes it will be wind waves (shorter periods). Color contours on the chart show significant wave height in meters, defined as the average of the highest third of all waves present. The wind barbs and feathers show forecast wind speed (in knots) and direction in the usual manner. There are also wave charts for the four Canadian Great Lakes. Lake Michigan is not shown, as it is the only one of the Great Lakes entirely within the U.S.
Looking to the south, in Mexico it is the Servicio Meteorológico Nacional that provides weather services from the government. The website is in Spanish, and for those of us who are not familiar with that language, it requires some extra diligence to find what is important to us. From the front page of the website, to find products of interest to the ocean voyager, hover over the tab for “Modelos de Pronóstico Numérico” and select the “SIPROMAT” link. This will bring up a page of model data of interest to mariners. SIPROMAT is a Spanish acronym for their system of generating these marine products, and it utilizes several U.S. models, including the GFS, WRF and WaveWatch III along with other specialized adaptations to the waters of interest. The regions available are the Gulf of Mexico, the Mexican Pacific coastal region and the entire Pacific.
 |
|
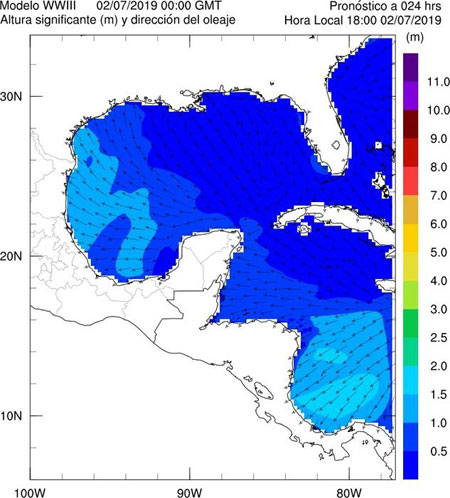
Figure 2: Wave height chart from SIPROMAT, Servicio Meteorológico Nacional, 24-hour forecast valid at 1800 local time on July 2, 2019. |
 |
|
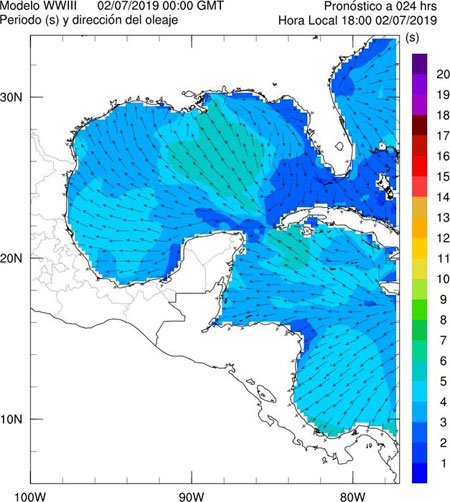
Figure 3: Wave period chart from SIPROMAT, Servicio Meteorológico Nacional, 24-hour forecast valid at 1800 local time on July 2, 2019. |
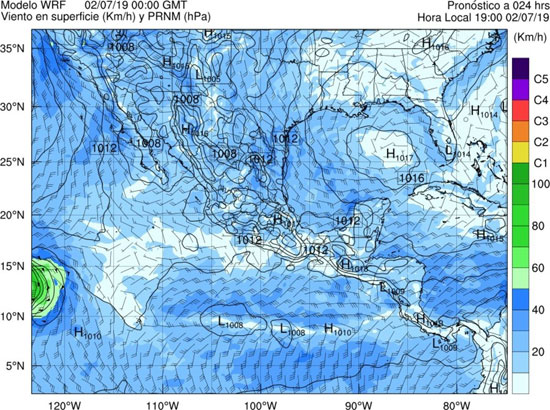
The charts available are sea state (Oleaje), storm surge (Marea de tormenta) and wind (Viento). Figure 2 is a sample of a chart showing forecast significant wave height in meters and primary swell direction for the Gulf of Mexico. Figure 3 shows the forecast peak wave period in seconds for the same time. Figure 4 is a sample of the chart from the wind link. In addition to winds, forecast isobars and pressure centers are shown on this chart. Forecast wind speeds are contoured in colors, and wind barbs and feathers indicate the wind speed and direction throughout the chart. It is important to realize that wind speeds on this chart are given in kilometers per hour (km/h), both in the color contours and the wind feathers. C1 through C5 on the wind speed legend refers to wind speeds associated with the Saffir-Simpson Hurricane Scale.
 |
|
Figure 4: Wind and pressure chart from SIPROMAT, Servicio Meteorológico Nacional, 24-hour forecast valid at 1900 local time on July 2, 2019. |
The main message in presenting these products from our U.S. neighbors is to make ocean voyagers aware that there are resources of value available from other countries. While the formats and presentations are a bit different than folks might be used to in the U.S., the types of information presented are the same. It is important to focus on the units used for each product. For those used to seeing wave heights in feet, make sure to be aware when you are looking at this data in meters. While wind speeds in Canadian marine products are generally presented in knots, land-based forecasts are given in km/h, and the Mexican marine products show winds in km/h. In other parts of the world, wind speeds may be given in meters per second. It is always best to research the methods to receive data from other sources well in advance of any ocean voyage.