The Marion Bermuda sailboat race took place a week earlier than normal this year due to the America’s Cup races going on in Bermuda, thus allowing the racers to become spectators for that event once they reached the island. Of course, finishing their own race was the first priority, and given that the forecast just prior to the race start on Friday, June 9, included some significant areas of very light wind along the route from New England toward Bermuda, there was the real prospect that much of the fleet would be arriving a bit later than they had planned.
It appeared that there would be plenty of wind for the start of the race on Friday at midday, and that reasonable wind would prevail to get the fleet to the Gulf Stream in good shape by later Saturday, and then that the wind would drop off to nearly nothing later in the weekend and into Monday south of the Gulf Stream. Looking at the forecast charts that were presented at the skipper’s briefing on Thursday afternoon, this becomes rather clear.
 |
|
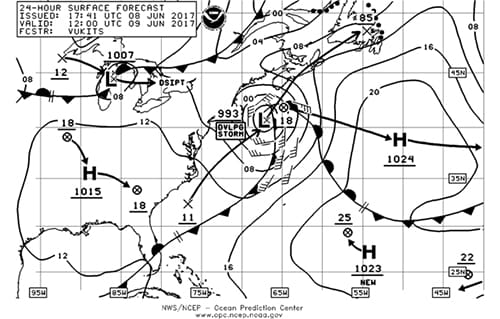
Figure 1 |
The 24-hour forecast chart (Figure 1, valid at 0800 EDT Friday) shows a rather strong low centered east of New England that is producing some very strong winds but is also moving quickly away from the area of interest. This would mean that as the race started at midday on Friday, moderate WNW winds would be expected on Buzzards Bay, but a backing to WSW would occur through the afternoon as the low moved farther away and sea breeze influences began to take hold.
 |
|
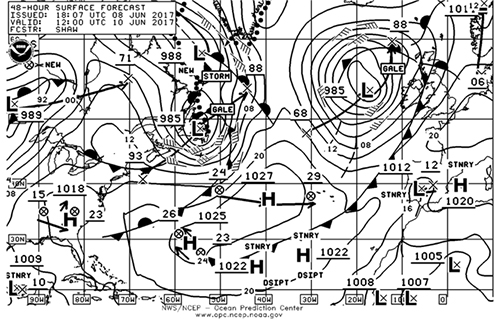
Figure 2 |
The 48-hour forecast chart (Figure 2, valid at 0800 EDT Saturday) shows the strong low over Newfoundland, well away from the race course, and a much weaker pressure gradient south of 40° N toward Bermuda with the isobars farther apart, though this chart would still indicate enough wind from the WSW to sail.
 |
|
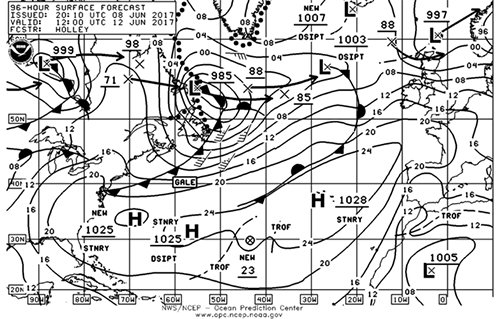
Figure 3 |
The 96-hour forecast chart (Figure 3, valid at 0800 Monday) shows the real concern: a small high center to the north of Bermuda, indicating an area of very little wind with most of the fleet likely to be moving into that region at that time. This is the type of pattern where faster boats will reach the area of light wind first, allowing slower boats to catch up.
These charts are synoptic charts though, and are meant to show weather features on the synoptic scale, which is sometimes called “weather map” scale, or “continental” scale. In other words, the larger-scale features are best shown by these charts. However, there are often smaller-scale features, called mesoscale features, that come into play. A hint of this can be gleaned from the 48-hour forecast chart by understanding that the stationary frontal boundary near Bermuda lies in a trough of low pressure, as do all fronts. This means that there will be a narrow ridge of high pressure induced just to the north of the front, and in fact it is this ridge that evolves into the small synoptic scale high seen on the 96-hour forecast chart.
 |
|
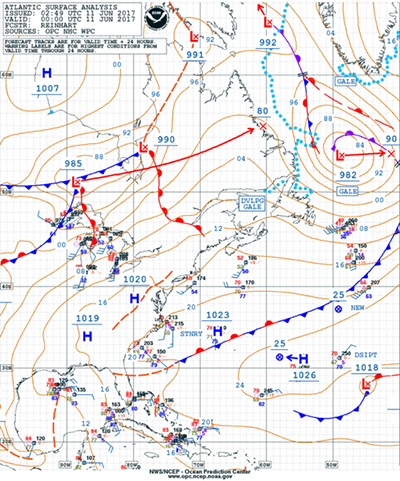
Figure 4 |
Sometimes there are even more subtle features that can show up and can have dramatic impacts on a sailboat race. To illustrate this, let’s examine the surface analysis chart valid at 8 p.m. on Saturday, June 10 (0000 UTC June 11, Figure 4). On this chart, the stationary front is in place north of Bermuda, oriented in a WSW to ENE fashion. As described above, this represents a trough of low pressure. A high center is shown just north of the front, and likely represents the highest pressure along a ridge of high pressure roughly parallel to the frontal boundary. From this high/ridge moving north, pressures generally fall toward the northeastern U.S. and eastern Canada. This would imply, on the synoptic scale, that winds would be generally WSW or southwest along the route toward Bermuda from around 35° N northward, though the wind speeds would not be particularly robust since the isobars are spaced rather far apart. At the time of this chart, most of the Marion Bermuda fleet would be nearing the Gulf Stream with some of the faster boats just into the Gulf Stream.
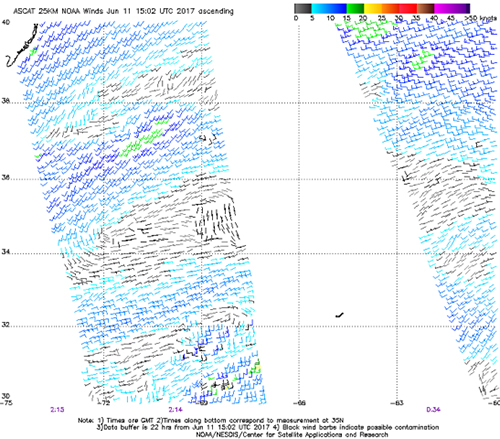
Also available to us is data from a polar-orbiting satellite called ASCAT. This satellite has a radar instrument on board that senses the roughness of the ocean surface and, through an algorithm, can produce from that a wind speed and direction field. Over many years of use, this data has been found to be quite accurate. Figure 5 is a slice of data from this satellite taken a little after 0200 UTC on June 11, or about two hours after the surface chart referenced above, and this data is very interesting. The color-coded scale at the top of the chart indicates wind speed in knots, and we can see an area of gray wind barbs extending ENE from south of 34° N on the western end of the data slice, to between 34° N and 36° N. This represents the light winds associated with the ridge north of the front. Recall that we anticipated a general WSW or southwest wind flow to the north of this ridge all the way to New England, and indeed there are signs of this, but there are two features within that area that stand out. First, there is a small area of green wind barbs indicating wind speeds in the 15- to 20-knot range, and these are likely over the Gulf Stream. The second is another, smaller area of gray wind barbs to the north of the Gulf Stream indicating a small area of very light wind.
 |
|
Figure 5 |
These subtle differences in the wind field cannot be discerned from the synoptic scale chart and are indeed mesoscale features. The likely culprit is the Gulf Stream due to the warmer air over the Gulf Stream being a bit less dense and therefore leading to slightly lower pressure. And, if there were showers or squalls over the stream at that time, that would indicate upward motion, which is also a mechanism to lower the pressure. With the pressure a bit lower than the synoptic scale pressure field would suggest, we would likely find a corresponding very narrow mesoscale ridge north of the Gulf Stream resulting in the small area of light winds. Once north of that feature, the wind field reverts to the expected light southwest flow. It is also important to understand that the mesoscale features, in addition to being smaller and subtler than synoptic scale features, also evolve and exist on shorter time scales.
Back to the Marion Bermuda Race: The race was very interesting in that, as the pre-race forecast suggested, the faster boats were quicker off the start, but once they reached the lighter wind south of the Gulf Stream they slowed considerably and the slower boats were able to catch up. The entire fleet finished within an 18-hour period, which is quite unusual for a race from New England to Bermuda, and the first boat over the line was last on corrected time. The slower boats in the slower class, though, got caught in the mesoscale area of light wind north of the Gulf Stream, which was not present several hours earlier when the rest of the fleet moved through that area, and this pushed them to the lower end of their class.
For reference, the ASCAT wind data can be accessed at the following link: https://manati.star.nesdis.noaa.gov/datasets/ASCATData.php.