Editor’s note: We’re revisiting this series on navigating by the sun, moon, stars and planets in the age of GPS because celestial nav is not only a viable backup to satellite navigation, but it’s also a skill that ocean voyagers should have in their toolkit. During the next few issues, we’ll cover all the basic knowledge you’ll need to get up to speed on this rewarding nav technique.
In this installment, we’ll discuss how to make our own chart for plotting our celestial navigation data at sea, and we’ll review dead reckoning, plotting, current vectors and compensating for current.
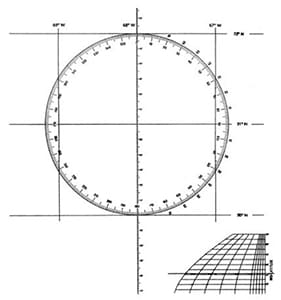
In part one, we ended with a discussion of the types of chart projections and why the Mercator-type chart — with the lines of longitude being parallel to each other — was the best for our purposes. We talked about a specific type of Mercator chart, the Universal Plotting Sheet. These sheets are dubbed universal because they are printed with lines of latitude but without any lines of longitude. This isn’t some mistake by the Government Printing Office. The longitude lines are not there because it’s our job to draw them onto the chart in the right place. Remember in our discussion of longitude we said that while the distance between whole degrees of latitude is fixed at 60 miles, the distance between whole degrees of longitude changes with latitude. The closer we get to the poles, the closer the lines of longitude.
Notice the small graph on the lower right of the Universal Plotting Sheet. This is actually our longitude scale. Notice that it looks like a quarter of the Earth (up to 70 degrees anyway, the polar regions aren’t included because few people sail there!). The bottom horizontal line of this longitude scale figure (which is called a nomograph) is labeled 0 degrees, or the equator. This is where the distance between the vertical lines of longitude is the greatest. As you go higher, the lines converge, showing this decreased distance. We can use this nomograph to set up our plotting sheet based on the mid-latitude of our dead reckoning position.
Let’s say we have a DR position with a latitude of 31° N. You take a straight edge and draw a line horizontally across the graph at 31. Then, use your dividers to measure 60 minutes of longitude off the longitude scale where you’ve just drawn that line. Starting from the center of the plotting sheet, measure out along the mid-latitude line (the printed latitude line in the middle of the paper) with the divider spread you found from the longitude scale. Make a mark and then do the same thing on the other printed latitude lines, then draw a vertical line through those points. You now have a line of longitude on your plotting sheet. Take your dividers and mark out that same distance from the center of the plotting sheet in the other direction, make your marks and connect them. Now you have multiple lines of longitude.
There’s even a way to check your work. There is a handy scale printed on the outside of the compass rose to help us do this. Start at 90° on the compass rose and, using the outside scale, count up on the same number of degrees as the mid-latitude (31 degrees here). Make a small mark on the rose. Now, again using the outside scale, count down from 90° and place a mark at 31° as well. Those marks you made should fall right on the longitude line you’ve already drawn. Even though the helpful outside scale is missing, you can use the same technique on the other side of the rose starting at 270°.
Finally, once you’re sure your lines of longitude are just as far apart as they are supposed to be for a mid-latitude of 31°, label all the lines of latitude and longitude. You’ve now made your own Mercator chart!
Before we go on with more about celestial navigation, let’s stop and review some basic plotting and dead reckoning skills. We’ll need these skills as the basis for our celestial navigation work.
Speed/time/distance formulas
There are three key formulas for determining speed (S), time (T) or distance (D) given the other two:
1) S = D/T
2) T = D/S
3) D = S x T
Whenever you are faced with a speed/time/distance problem, the first step is to decide what you are trying to find and select the formula that has that isolated on the left.
For example, if you had been traveling for two hours at 6 knots and want to find out how far you have gone, you would use D = S x T. Plugging the numbers in: D = 6 x 2 = 12 miles covered. Or maybe you are trying to figure out how long it will take to get to a certain harbor. You know it is 15 miles away and you are sailing at 6 knots. Here use T = D/S. Or, T = 15/6 = 2.5 hours.
These two examples work out nicely using time expressed in hours, but often you may be faced with a problem involving minutes. This is no problem. Just divide the number of minutes by 60. This will give you time in term of hours. For example, you have gone 20 minutes at 6 knots and want to know how far you have gone. First divide 20 minutes by 60 (20/60 = 0.33), then plug it into your formula: D = S x T = 6 x 0.33 = 2 miles. Using the same concept, if you get an answer for time with a bunch of numbers after the decimal point, multiply everything after the decimal point by 60. For example, 2.317 hours = 2 hours and 0.317 x 60 = 19 minutes.
In the section below, we look at the importance of determining direction and its role in dead reckoning.
 |
Direction
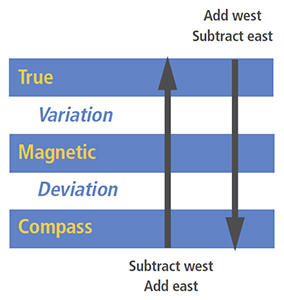
On yachts, the most common means for determining direction is a magnetic compass. A magnetic compass orients itself to the magnetic north pole. This is not the same as the North Pole. The direction based on the North Pole/South Pole axis is true. The difference between true direction and magnetic direction is called variation.
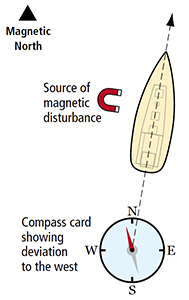
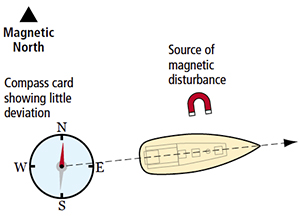
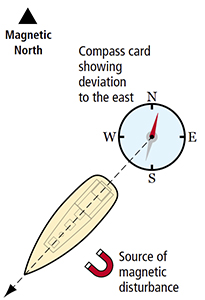
Unfortunately, there is another problem with direction. A magnetic compass may not always point toward magnetic north. The difference between the compass direction and magnetic direction is called deviation, which is not the same on all headings as is variation. The deviation to be applied to a bearing is dependent on the vessel’s heading and not the direction of the bearing.
On coastal charts, there is a clearly marked magnetic compass rose. It is not usually necessary to determine true direction for coastal work. However, every compass should have a deviation card and it should be used if there is deviation.
Both deviation and variation are described as “east” or “west.” When correcting from compass through magnetic to true direction, east corrections should be added and west corrections should be subtracted. For example, if your compass has a deviation of 7° E when your boat is headed north, then if you are headed 000° you must add 7° to get a magnetic course steered of 007°.
Variation is constant regardless of a vessel’s heading. Deviation is dependent on heading. Thus, if the boat in the example above was heading 000° and you took a bearing at 090°, you would still need to add 7° to get the magnetic bearing, even if the deviation at 090° is 1° E.
 |
 |
 |
|
A rough illustration of the cause of deviation. Notice that the deviation is different depending on the vessel’s heading. A deviation card gives the navigator the ability to correct for these magnetic disturbances. This diagram shows just one source of magnetic disturbance; there could be many. |
||
Dead reckoning
At its most basic, a dead reckoning (DR) position or track is made up of information on a vessel’s direction and distance covered. Usually this is plotted from information entered into the log each hour. Without an accurate record of course and speed, your DR track becomes much less valuable as it can be no better than your memory of courses, the times of course changes and of speed through the water. Converting a known speed traveled for a certain amount of time into distance is the most common use of the D = S x T formula.
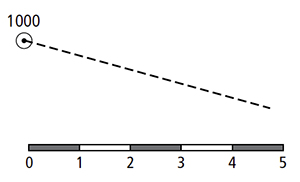
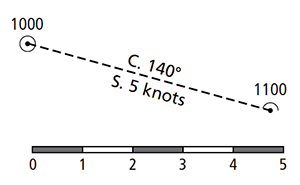
All DR tracks must start somewhere. Ideally, a navigator will start a DR track when departing and continue it throughout a trip. Often, the DR information will be supplemented by more accurate fixes. Subsequently, the DR track always will be run from the latest accurate fix. The figure at right shows a DR track begun at the fix for 1000. In this example, the vessel sailed five miles between 1000 and 1100 on a course of 140°.
 |
|
This shows a 1000 fix and the projected DR track run out ahead. This is a good method for foreseeing what obstacles can be expected in the near future. |
To plot the DR track, first line up parallel rules from the center of the compass rose to 140°. Move the rules to the fix and transfer this from the fix along the course line, mark that point with a DR symbol. All DR positions are marked with the time. This is important for reconstructing when you were at that position. A DR track is labeled with the course steered and the speed.
When navigating a sailboat, it often makes sense to add other factors to a DR track and position than just course and speed. Close hauled, many sailboats make a fairly consistent amount of leeway. If your boat can be relied upon to make 3°, for example, to leeward while close hauled, then it makes sense to incorporate this into your DR position. The set and drift of the current may also be added to determine your final “net” DR position that would be called an “estimated position” (EP).
Any information that you incorporate into this DR position should be dearly noted on your chart and/or logbook. Otherwise it may be difficult to remember exactly how you got that position.
A DR position should be your best estimate of your position. The more carefully it is constructed, the more helpful it will be. It is also true that a navigator used to incorporating many types of information into a DR track will be more aware of forces affecting the boat.
 |
|
This shows the DR track at the end of an hour. Note that the track is labeled with the course and speed. The position at 1100 is marked with a semicircle to denote that it is a DR position based on course and speed from the last fix. |
Keeping a good DR track and frequent DR positions is one of the surest ways to stay aware of the navigational hazards and aids both around you and coming up. Don’t be distressed about leaving the DR track or DR position in favor of a more accurate “fix.” Think of this as further refinement, which should be going on constantly.
Plotting DR positions should be ongoing. Although you might only plot the DR position every four hours or so when out in the middle of an ocean, the information from which that track is determined should be recorded in the log every hour.
In general, a DR track consists of a course and distance (derived from boat speed and time). If there is a noticeable current, this should be factored into the overall plot, especially if you are running it ahead. The estimated current should always be noted so that you have a record.
It makes sense to run a “pure” DR track consisting of just course and speed even if you have a track that includes current. It is only by comparing this “pure” DR position with a fix that you can determine the set and drift of the current. Other corrections that should be factored into the DR position include any leeway that your vessel makes and an allowance for wave action if that seems appropriate. Unlike coastal situations where each leg of a trip may only be a few miles, after days of going in the same direction each of these factors is significant. Most important, label all positions with the time. With a well-labeled plotting sheet, it’s easy to see what has been going on over the past hours or days.
 |
|
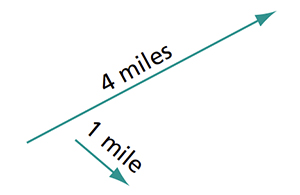
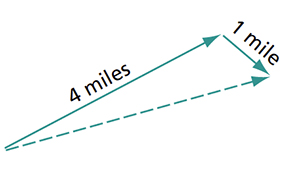
The top vector could describe a boat’s course and speed. The length of the vector is four miles long, which describes the boat’s speed of 4 knots. The arrow is oriented in the direction of 045° — the boat’s course. The bottom arrow describes a current with a drift of 1 knot and a set of 135°. |
Current vectors
A current is the description of the movement of water over the bottom. The direction of this movement is the set, and the speed of the movement is the drift. Set is described by the direction the current is headed, just like the heading of a boat. Current may be caused by tides in many coastal situations. It may also be the result of rivers or great ocean currents like the Gulf Stream. Some of these may be fairly consistent, others vary regularly with the state of the tide and some are seemingly unpredictable. A few charts will display arrows showing the current’s set and drift at a certain place. There are also current roses. In both of these cases, the current is represented by a vector.
A vector is a line giving information about speed and direction. So, every time you go sailing, your boat’s progress can be shown as a vector of its speed and course.
The set and drift of the current may also be shown as a vector. The length of the vector corresponds to the current’s drift, and the direction that the vector is pointed corresponds to the current’s set.
 |
|
This shows the DR track at the end of an hour. Note that the track is labeled with the course and speed. The position at 1100 is marked with a semicircle to denote that it is a DR position based on course and speed from the last fix. |
Given a course steered, we add the two vectors together in order to find the course and speed made good.
To add the boat’s and the current’s vectors, place the tail of one at the point of the other. Now draw another vector from the free tail to the free point. This vector represents the sum of the two added vectors.
The result of adding these two vectors together is the boat’s course and speed over the ground (course and speed made good). This is the track the boat would actually follow.
Determining set and drift
The two most common uses for vector analysis with currents are 1) determining the set and drift of an unknown current, and 2) determining a course to steer and speed made good given a known current. Let’s work on determining set and drift first. This will not work without keeping an accurate DR track. Let’s say that at 1000 you got a fix from visual bearings. During the next hour you averaged 7 knots on a course of 080°. You then got another fix at 1100. Plot all that info.
 |
|
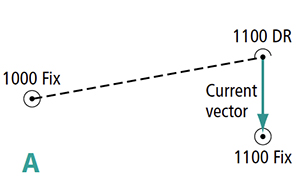
Figure A |
The DR track in Figure A is the vector for your boat’s course and speed through the water. The distance and course from the 1000 fix to the 1100 fix is the speed and course made good. This is the track over the bottom that you actually followed, regardless of where your bow was pointed. The current then pushed you from the DR at 1100 to the fix at 1100. That is its vector. To measure its set, just determine the direction from the DR to the fix with parallel rules and the compass rose. To determine its drift, measure the distance it pushed you in an hour.
If there had been less than an hour between fixes, you’d determine drift based on this formula: First, determine what part of an hour you were underway (minutes/60); second, measure distance from the DR to the fix; third, apply the formula S = D/T.
Now that you know the current, determine course to steer in order to make good the correct course. For this, you need a compass rose and a scale.