In late November 2012, many news outlets carried the story of Sandy Island. According to numerous charts and maps, the 15-mile-long island was located in the South Pacific between New Caledonia and Australia. When scientists studying the Pacific steamed to the reported site of the island on their research vessel, however, they saw only open ocean.
Sandy Island’s tale is only the most pointed example of the sometimes spotty state of marine charts worldwide. There are many places where the charts are less than accurate due to old, data-thin surveys. Many national hydrographic offices have not invested resources to re-survey these areas. But there’s a new approach to marine surveying: crowd sourcing. Vessels equipped with depth sounders and GPS receivers collect surveying data and send it on to be integrated with other data to make new, more accurate charts.
There are several crowd-sourced chart efforts underway. One of the big electronic chart firms, Navionics, has the option of adding crowd-sourced data with its Freshest Data program (navionics.com/en/save-50-chart-update). According to Rich Lauer, Canada and northeast U.S. sales manager, as many as 250,000 edits have been made to the community layer of Navionics charts. A European crowd-sourcing effort called TeamSurv (www.teamsurv.com) is based in Portsmouth in the U.K. TeamSurv’s major partners include Smartcom Software and Digital Yacht in the U.K.
According to Tim Thornton of TeamSurv, crowd sourcing can help fill the gap in poorly surveyed areas. “NOAA reported to the International Hydrographic Organization that 40 percent of U.S. waters (in its Exclusive Economic Zone of 3.3 million square nautical miles) under 200m in depth, and 99 percent of its deeper waters, have either never been surveyed or need resurveying to modern standards,” Thornton wrote in an e-mail, “but NOAA surveyed just 2,500 square nautical miles in 2010.”
Can these types of crowd-sourcing efforts help improve the charts that voyagers use? One of the amazing aspects of the Sandy Island case is that it took 239 years to run down the erroneous charting of Sandy Island. The island was included on official charts from the British, Australian, German, French, Italian, Japanese, U.S. and Russian hydrographic offices from the initial UKHO chart in 1774, as well as atlases and Google Maps.
TeamSurv, which has received European Union research funding, has provided accurate data during its initial work in the U.K. and France and is now branching out beyond European waters. “This includes the Coral Reef Research Foundation in Palau in the Pacific,” Thornton wrote, “where three boats will shortly begin logging data for the project — the official charts for the area date back to 1927, when the islands were owned by Japan, and are described as ‘horrifically inaccurate’ by modern users.”
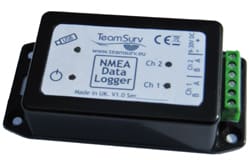
The TeamSurv approach calls for users to sign up with the program and then be issued a piece of gear called a data logger. The unit is supplied on loan to connect to a depth sounder and GPS. Most of the participants in the TeamSurv project — more than 200 vessels worldwide with that number expected by Thornton to double — are recreational boats, along with fishing boats and workboats.
“A typical participant is someone like Richard Gatehouse, who sails a 36-foot Maxi 1100 on the south coast of England, in Brittany, and occasionally to the Baltic,” Thornton wrote. Gatehouse uses one of TeamSurv’s data loggers to interface with his Seatalk instruments and gathers NMEA 0183 data. The data is recorded to a USB memory stick and at the end of the trip Gatehouse uploads the depth and position data to the TeamSurv website for processing. He doesn’t need Wi-Fi or cell phone coverage and there is no communications cost while he is gathering the data.
“Once uploaded, he can automatically see his tracks on the website. The next morning, the tracks can be seen corrected for tide (using a combination of tide predictions and actual tide gauge data). We then periodically create charts for an area that can be downloaded as a PDF, giving detailed and up-to-date depths for an area.”
According to Thornton, the charts just provide depth information and so should be used as an aid to navigation alongside standard charts.
Thornton said the initial areas that TeamSurv focused on were relatively well surveyed. This provided a baseline for verifying the TeamSurv concept. Going forward Thornton says poorly surveyed areas are where new data should be most useful. “We see TeamSurv being a real benefit for areas where there facilities for normal hydrographic surveying are limited or non existent.”
TeamSurv is looking for more participants and would like to sign up North American boaters. “Many of the PC-based chartplotters can log data in a format that we can process, as can Garmin and some other electronic chartplotters and fish finders with a memory card, or we can lend you a data logger free of charge.” To participate, boaters can register on the TeamSurv website.
According to Hasko Scheidt, the founder of NV-Charts in Germany (www.nv-charts.com), crowd sourcing raises questions about the accuracy of the process. “It’s very important that people know what type of data they put into their units,” Scheidt said. According to Scheidt, there are a variety of variables such as transducer location, state of tide, datum used and more.
In the years to come, voyagers will see if the crowd-sourcing trend develops into a useful tool for making better charts.

