Editor’s note: While this story involves a sailing vessel under power rather than an exclusively power-driven vessel, it is useful for power voyagers as it provides a useful approach to making long passages under power for single-screw vessels.
Aboard Del Viento, our 1978 Fuji 40 sloop, fuel consumption had long been a bit of a mystery. I knew that we improved fuel economy when we throttled back, but by how much? What was the tradeoff for a longer passage? By how much could we increase our range? Where was the sweet spot?
Planning our passage up the North Pacific coast of the Americas, from La Paz, Mexico, to Victoria, B.C., I knew we would spend a lot of time motoring (our route directly opposed thousands of miles of prevailing winds and currents) and that long stretches of the coastline offered no place to stop and fill up. I needed to know our fuel burn rate at various RPMs so that I could project our range before heading off — and I needed to be able to apply this information underway so that if faced with contrary currents or an adverse sea state, I could determine how much to adjust the throttle to preserve our anticipated range.
 |
|
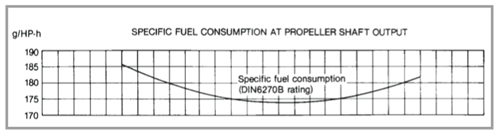
The Yanmar’s specific fuel consumption curve. |
I had tried determining our fuel burn rate by dividing the number of gallons I’d put in the tank by the number of hours we’d run the engine. But each time the quotient varied — sometimes dramatically. This made sense as our engine use varied. Sometimes we pushed our 20-year-old 55-hp turbocharged Yanmar at 80 percent of maximum rated RPM for several hours to gain another knot of speed to make an anchorage before dark. Sometimes we motored miles up a narrow channel at 25 percent power or let the engine idle for a couple hours at anchor to charge our batteries. All I had was a rough sense of our fuel burn rate.
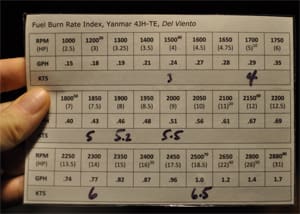
Then I figured out a way to get accurate information, quickly and easily. I didn’t install a fuel flow meter, I simply learned how to read a couple of the performance curve graphs in my engine manual, crunched a few numbers, and came up with a handy index I keep aboard. Using this index, a quick look at my tachometer allows me to determine how much fuel we’re burning per hour at any time. Knowing my speed over ground (SOG) and the amount of fuel in our tank allows me to determine our range.
Like most diesel auxiliaries, the service manual for our Yanmar includes several performance curve graphs. (These graphs are near the front, with the specifications for the motor. Surprisingly, the regular operator’s manual for my engine doesn’t include this information, but a brochure for our engine does, in a condensed form.) To make my index, I had only to understand two of these performance curve graphs: propeller power curve and specific fuel consumption curve.
The propeller power curve graph is easy. It shows how much horsepower is required to spin your engine’s crankshaft at a specific RPM. (This data assumes your transmission gear reduction is as specified and your prop is pitched to spec.) For example, the propeller power curve graph shows that five hp is required to spin the motor at 1,700 RPM and 38 hp is required to spin it at 3,200 RPM.
The specific fuel consumption graph shows how many grams of fuel are burned over the course of an hour per horsepower generated at a given RPM (it makes sense to think of this as power-specific fuel consumption). Note: for my engine, this graph uses grams of fuel/horsepower, but for other motors, I’ve seen gallons of fuel/horsepower. If your values are in gallons, the calculations later are easier. It is interesting to note that for my Yanmar, like most diesels, the engine is most efficient (in terms of grams of fuel burned per horsepower generated) in the middle of the RPM range. But as I’ll get to later in this article, it is not necessarily most efficient to run a boat under power at RPMs where the engine is most efficient — in short, the engine’s efficiency in this RPM range may be overcome by the drag induced by a displacement hull at higher boat speeds.
I’ll use a roughly 300-mile passage we made aboard Del Viento, under power and in flat seas, from Eureka, Calif., to Astoria, Ore., to show how to obtain real-world fuel consumption data using propeller power curve and specific fuel consumption information. On a long, power-only passage like this, the value of this information is significant. Let’s plan this passage using three hypothetical power settings.
1,700 RPM
With the engine at this RPM, I’ve observed that Del Viento moves along at four knots in flat seas. Looking at the propeller power curve, I see that the engine generates about five hp to spin the crankshaft at this speed. On the specific fuel consumption curve, I see that at 1,700 RPM the engine is burning 185 grams of diesel per hour for every horsepower generated. That’s about 925 grams of diesel per hour at this rate (5 hp x 185 grams/hour). Because there are 3,221 grams of diesel per U.S. gallon, I calculate we’re burning 0.29 gallons per hour. Our 300-mile trip will take 75 hours and we’ll burn 21.75 gallons of fuel. Not too bad.
Six knots
But what if I want to increase our speed to six knots? It’s a comfortable speed, well below our 7.4-knot hull speed, but 50 percent faster than four knots. I advance the throttle and see that we need about 2,300 RPM to get up to six knots. That’s only a 35 percent increase in RPMs to get a 50 percent increase in speed. Plus, looking at the specific fuel consumption curve, our engine is more efficient at 2,300 RPM, burning only 177 grams per horsepower. Not bad, huh?
Not so fast. According to the propeller power curve, we need 14 hp to make 2,300 RPM — a 180 percent increase! We are now burning 0.77 gallons per hour (a 165 percent increase) and while our 300-mile trip will take only 50 hours, we will have burned 38.5 gallons (a 77 percent increase).
That’s a tough trade-off, burning 77 percent more fuel to get someplace 33 percent faster.
Maximum cruising RPM
Our maximum RPM at wide open throttle (WOT) is 3,600. Yanmar advises we not operate for sustained periods at more than 80 percent of this maximum, or 2,880 RPM. I move the throttle up until we’re just below 2,900 RPM. The knot meter says we’re pushing our hull through the water at 6.85 knots. At this RPM the engine is delivering 28 hp — and chugging just over one and a half gallons per hour! We’ll get to Astoria in less than 44 hours, but will have burned more than 66 gallons of fuel. Yikes!
Of course, modest increases in speed produce sharp increases in fuel burn rates because of the non-linear, exponential increases in drag a displacement hull produces as its speed through the water increases (called wave-making resistance). Because the entire range of drag (from zero drag to the drag produced at hull speed) happens over a narrow band of speed (zero knots to hull speed), every fraction of a knot can make a big difference in the fuel burn rate — especially the closer the hull is to hull speed.
As I indicated at the start, I did all of the above calculations for a number of RPM values and created an index. I was able to expand this index to include boat speed by correlating our knot meter and tachometer in calm seas (for example, observing that we moved along at four knots at 1,700 RPM). This speed information is helpful for projecting our range before leaving the dock, but underway, I ignore the knot values on our index and instead use our actual SOG from the GPS. This approach automatically factors in current and sea state influences.
Also, keep in mind that you can do more than throttle back to improve efficiency.
The propeller power curve and specific fuel consumption graphs in your manual are based on optimal, new-engine conditions. The amount of fuel your engine burns to generate the horsepower needed to reach a given RPM will be adversely affected by poorly functioning injectors, a lack of clean air, dirty oil, or a turbo that isn’t spinning freely. Keep your motor serviced! Cleaning your hull will go a long way to reducing drag and increasing your SOG at a given RPM.
Passagemaking on Del Viento, we sail whenever we can. But when our cruising itinerary requires we motor, we go as slowly as our patience and our weather window allows. Our wallet and the environment thank us.
————-
Michael Robertson lives aboard his Fuji 40 Del Viento with his wife Windy and daughters Eleanor and Frances. They are currently in Victoria, B.C.